

Financial Reporting
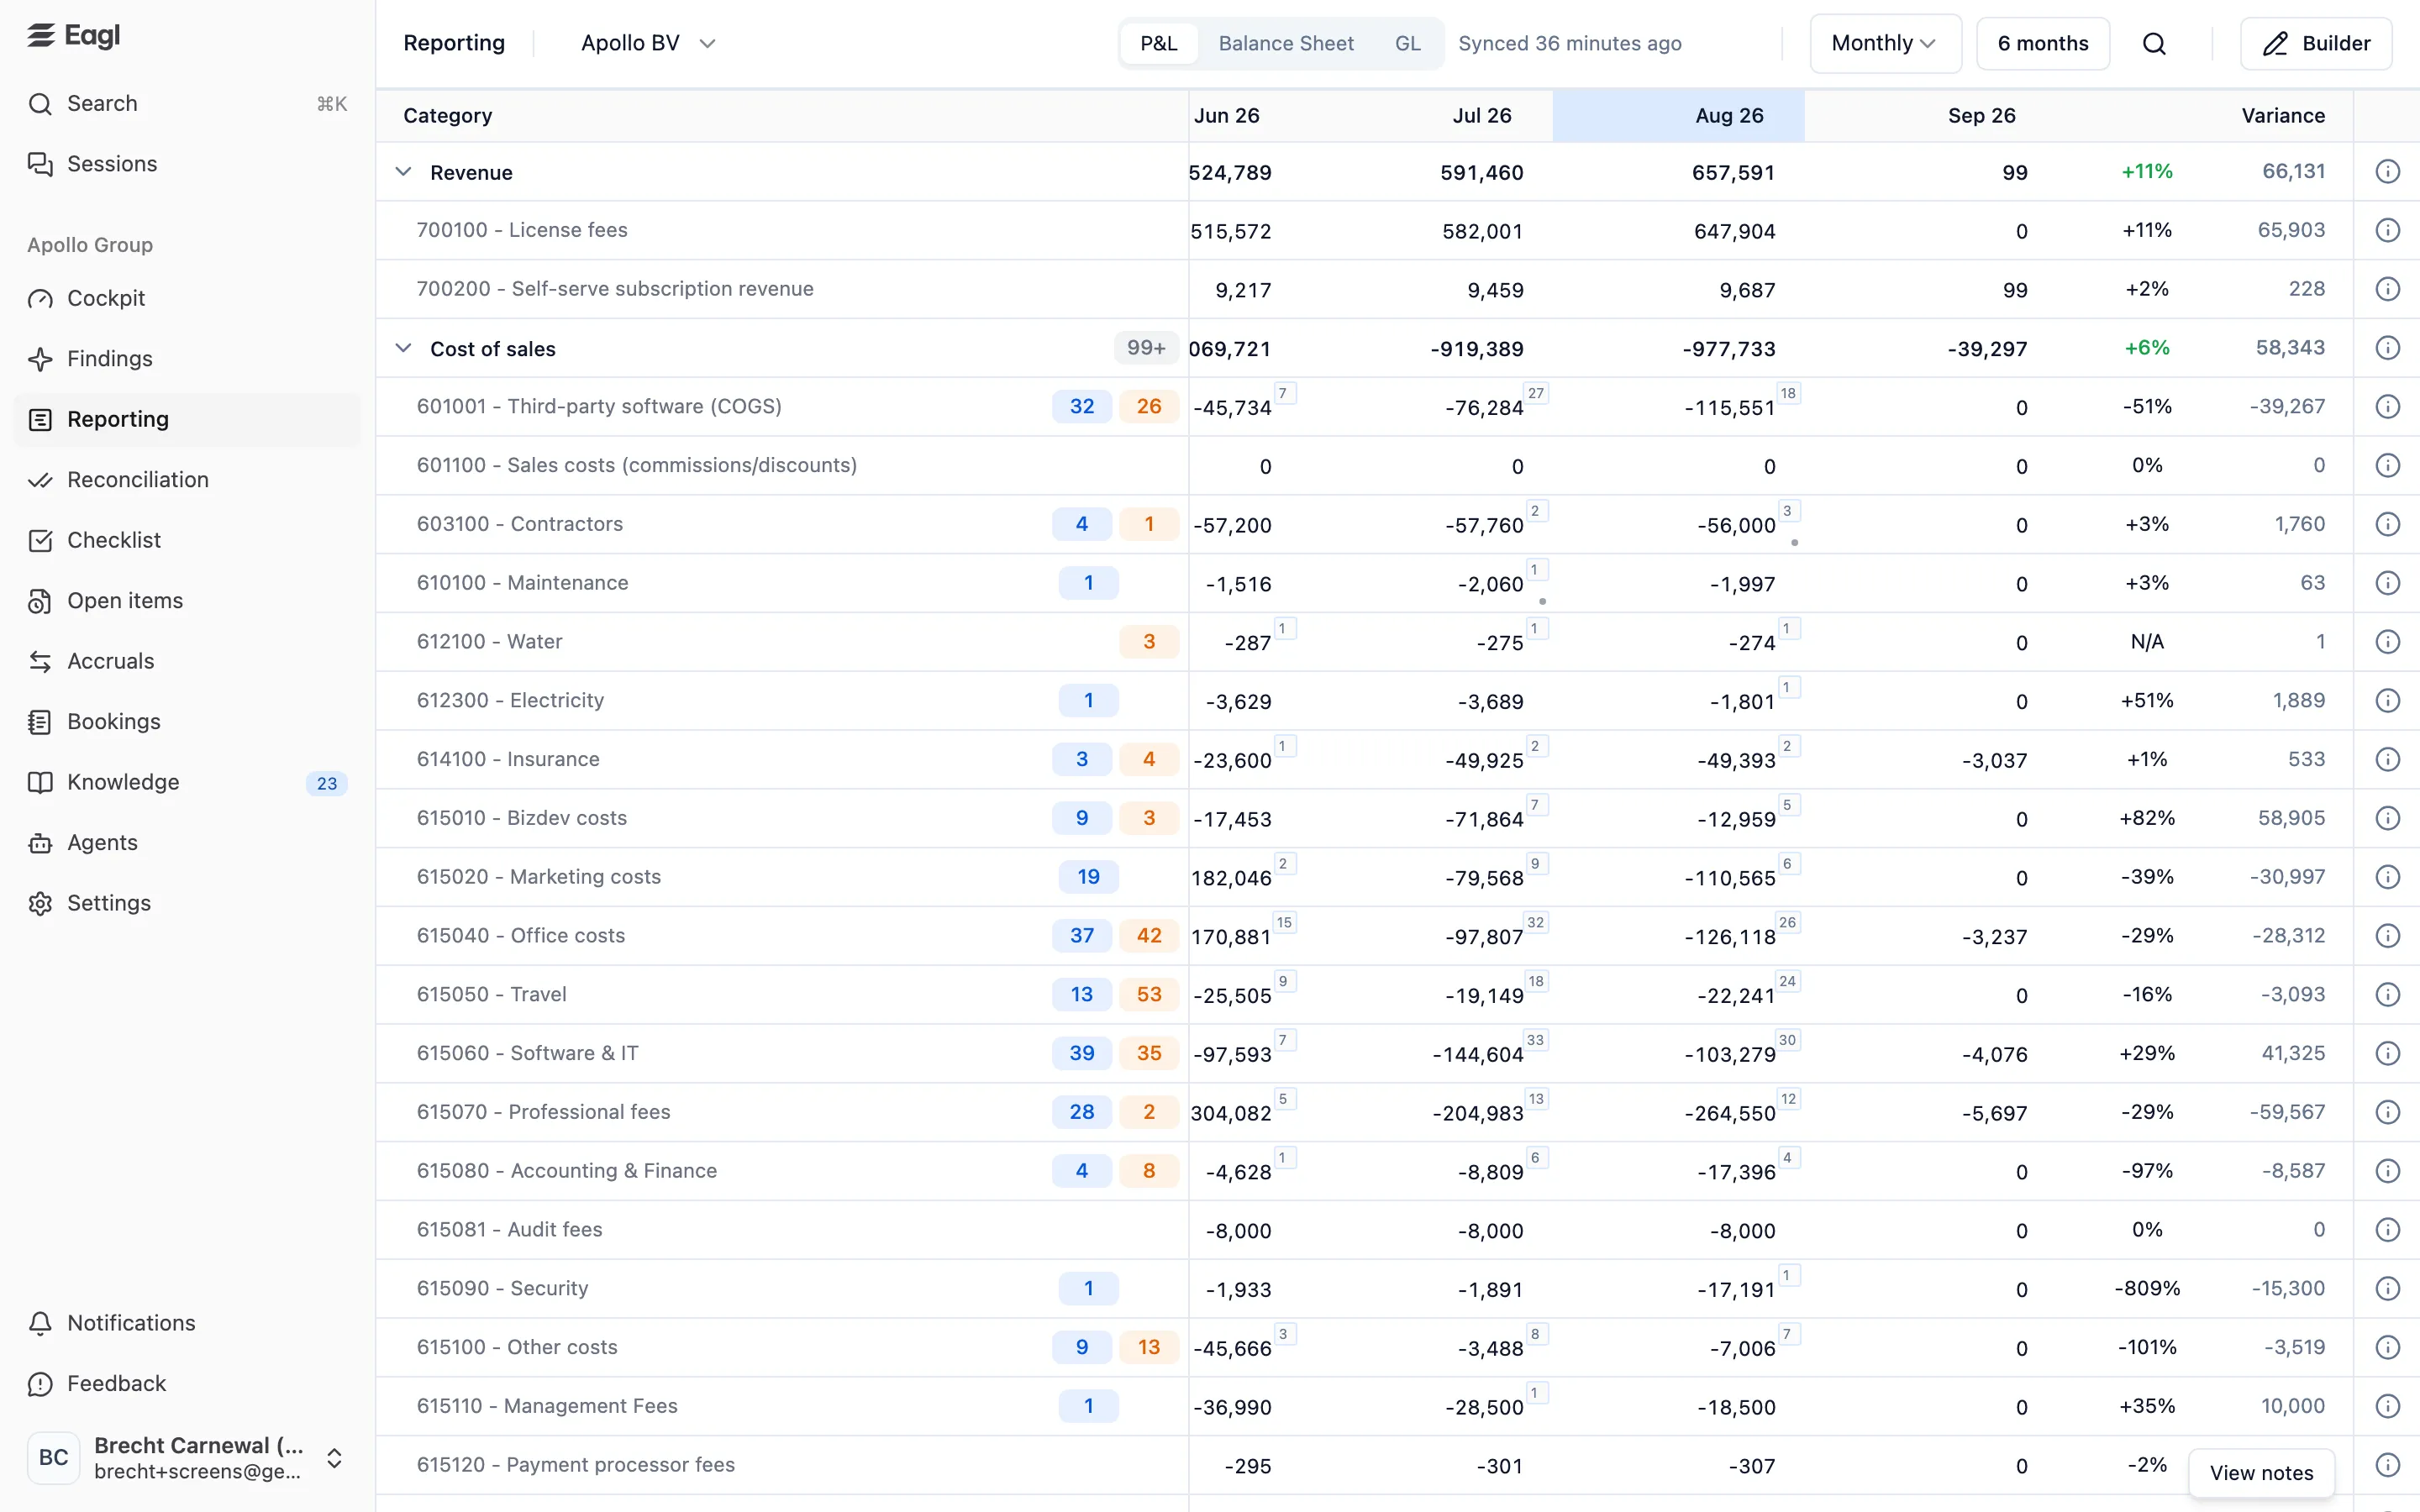
Reporting turns your synced general ledger into a P&L, a balance sheet, and a GL overview, month by month, without exporting to spreadsheets. Every number links to the transactions behind it, and the findings Eagl raised on each account show up right next to the figures.
Getting started
Section titled “Getting started”Open Reporting in the sidebar. The P&L for the entity you’re working in opens first.
You don’t have to build the reports yourself. Once your ERP has synced, Eagl creates a P&L, a balance sheet, and a GL structure for your organization from its standard templates and uses AI to classify each GL account into them. If you open Reporting while that’s still running, you’ll see Setting up your reports with a progress count. It can take a while, so feel free to come back later. After each ERP sync, Eagl also maps any new GL accounts automatically and leaves your existing placements alone.
The same structures apply to every entity in your organization. To change the layout or move an account, use the Reporting Builder.
The three reports
Section titled “The three reports”Switch between them with the toggle at the top of the page.
| Report | What it shows |
|---|---|
| P&L | The movement per period for each category and GL account, with subtotals such as Gross margin, EBITDA, EBIT, and Net result. Revenue shows as positive and costs as negative. |
| Balance Sheet | The closing balance at the end of each period, grouped into assets and equity & liabilities. Eagl adds the current year’s and previous years’ results to equity automatically. |
| GL | The movement per period for every GL account, grouped into Assets, Liabilities, Equity, Revenue, Expenses, and Other & Transfers. |
Reading a report
Section titled “Reading a report”The header holds all the controls:
| Control | What it does |
|---|---|
| Entity picker | Switch to another entity, or pick All Entities (see below). |
| P&L / Balance Sheet / GL | Switch reports. Your entity and period settings carry over. |
| Sync status | When your ERP data last synced, for example “Synced 35 minutes ago”. |
| Monthly / Quarterly | Show one column per month or per quarter (labeled like 2026-Q3). |
| 6 months | How far back the report goes: 6, 12, 18, or 24 months. |
| Search icon | Find a GL account on the report. See Find a GL account. |
| Builder | Open this report in the Reporting Builder. A number on the button counts GL accounts that aren’t on the report yet. |
Rows are categories (click to expand or collapse), GL accounts shown as code and name, and calculated subtotal and total lines. Eagl remembers which categories you expanded.
The highlighted column is the selected period. Click another column header to select it. The Variance column compares the selected period with the one before it, as a percentage and an amount. It shows N/A when the previous period was zero. If you select one of the two oldest columns, the report widens its window so you can keep going back.
Entities and consolidation
Section titled “Entities and consolidation”The entity picker lists the entities you have access to. Choosing one shows that entity’s figures.
All Entities adds up those entities into one consolidated report. It’s only offered when every entity reports in the same currency (Eagl doesn’t convert currencies, so it never sums mixed-currency entities) and when no GL account in the structure is limited to specific entities. When you drill down from a consolidated report, the drill-down stays consolidated.
Finding badges
Section titled “Finding badges”Eagl shows its findings on the accounts they’re about, for the periods on screen.
| Badge | Where | What it counts |
|---|---|---|
| Blue number | Next to a GL account | Business insights, such as a notable increase or decrease in spending. |
| Orange number | Next to a GL account | Accounting findings, such as missing transactions. |
| Gray number | Next to a category | All findings on the GL accounts inside that category. |
| Small number in a cell’s corner | On an amount | Findings for that account in that period. |
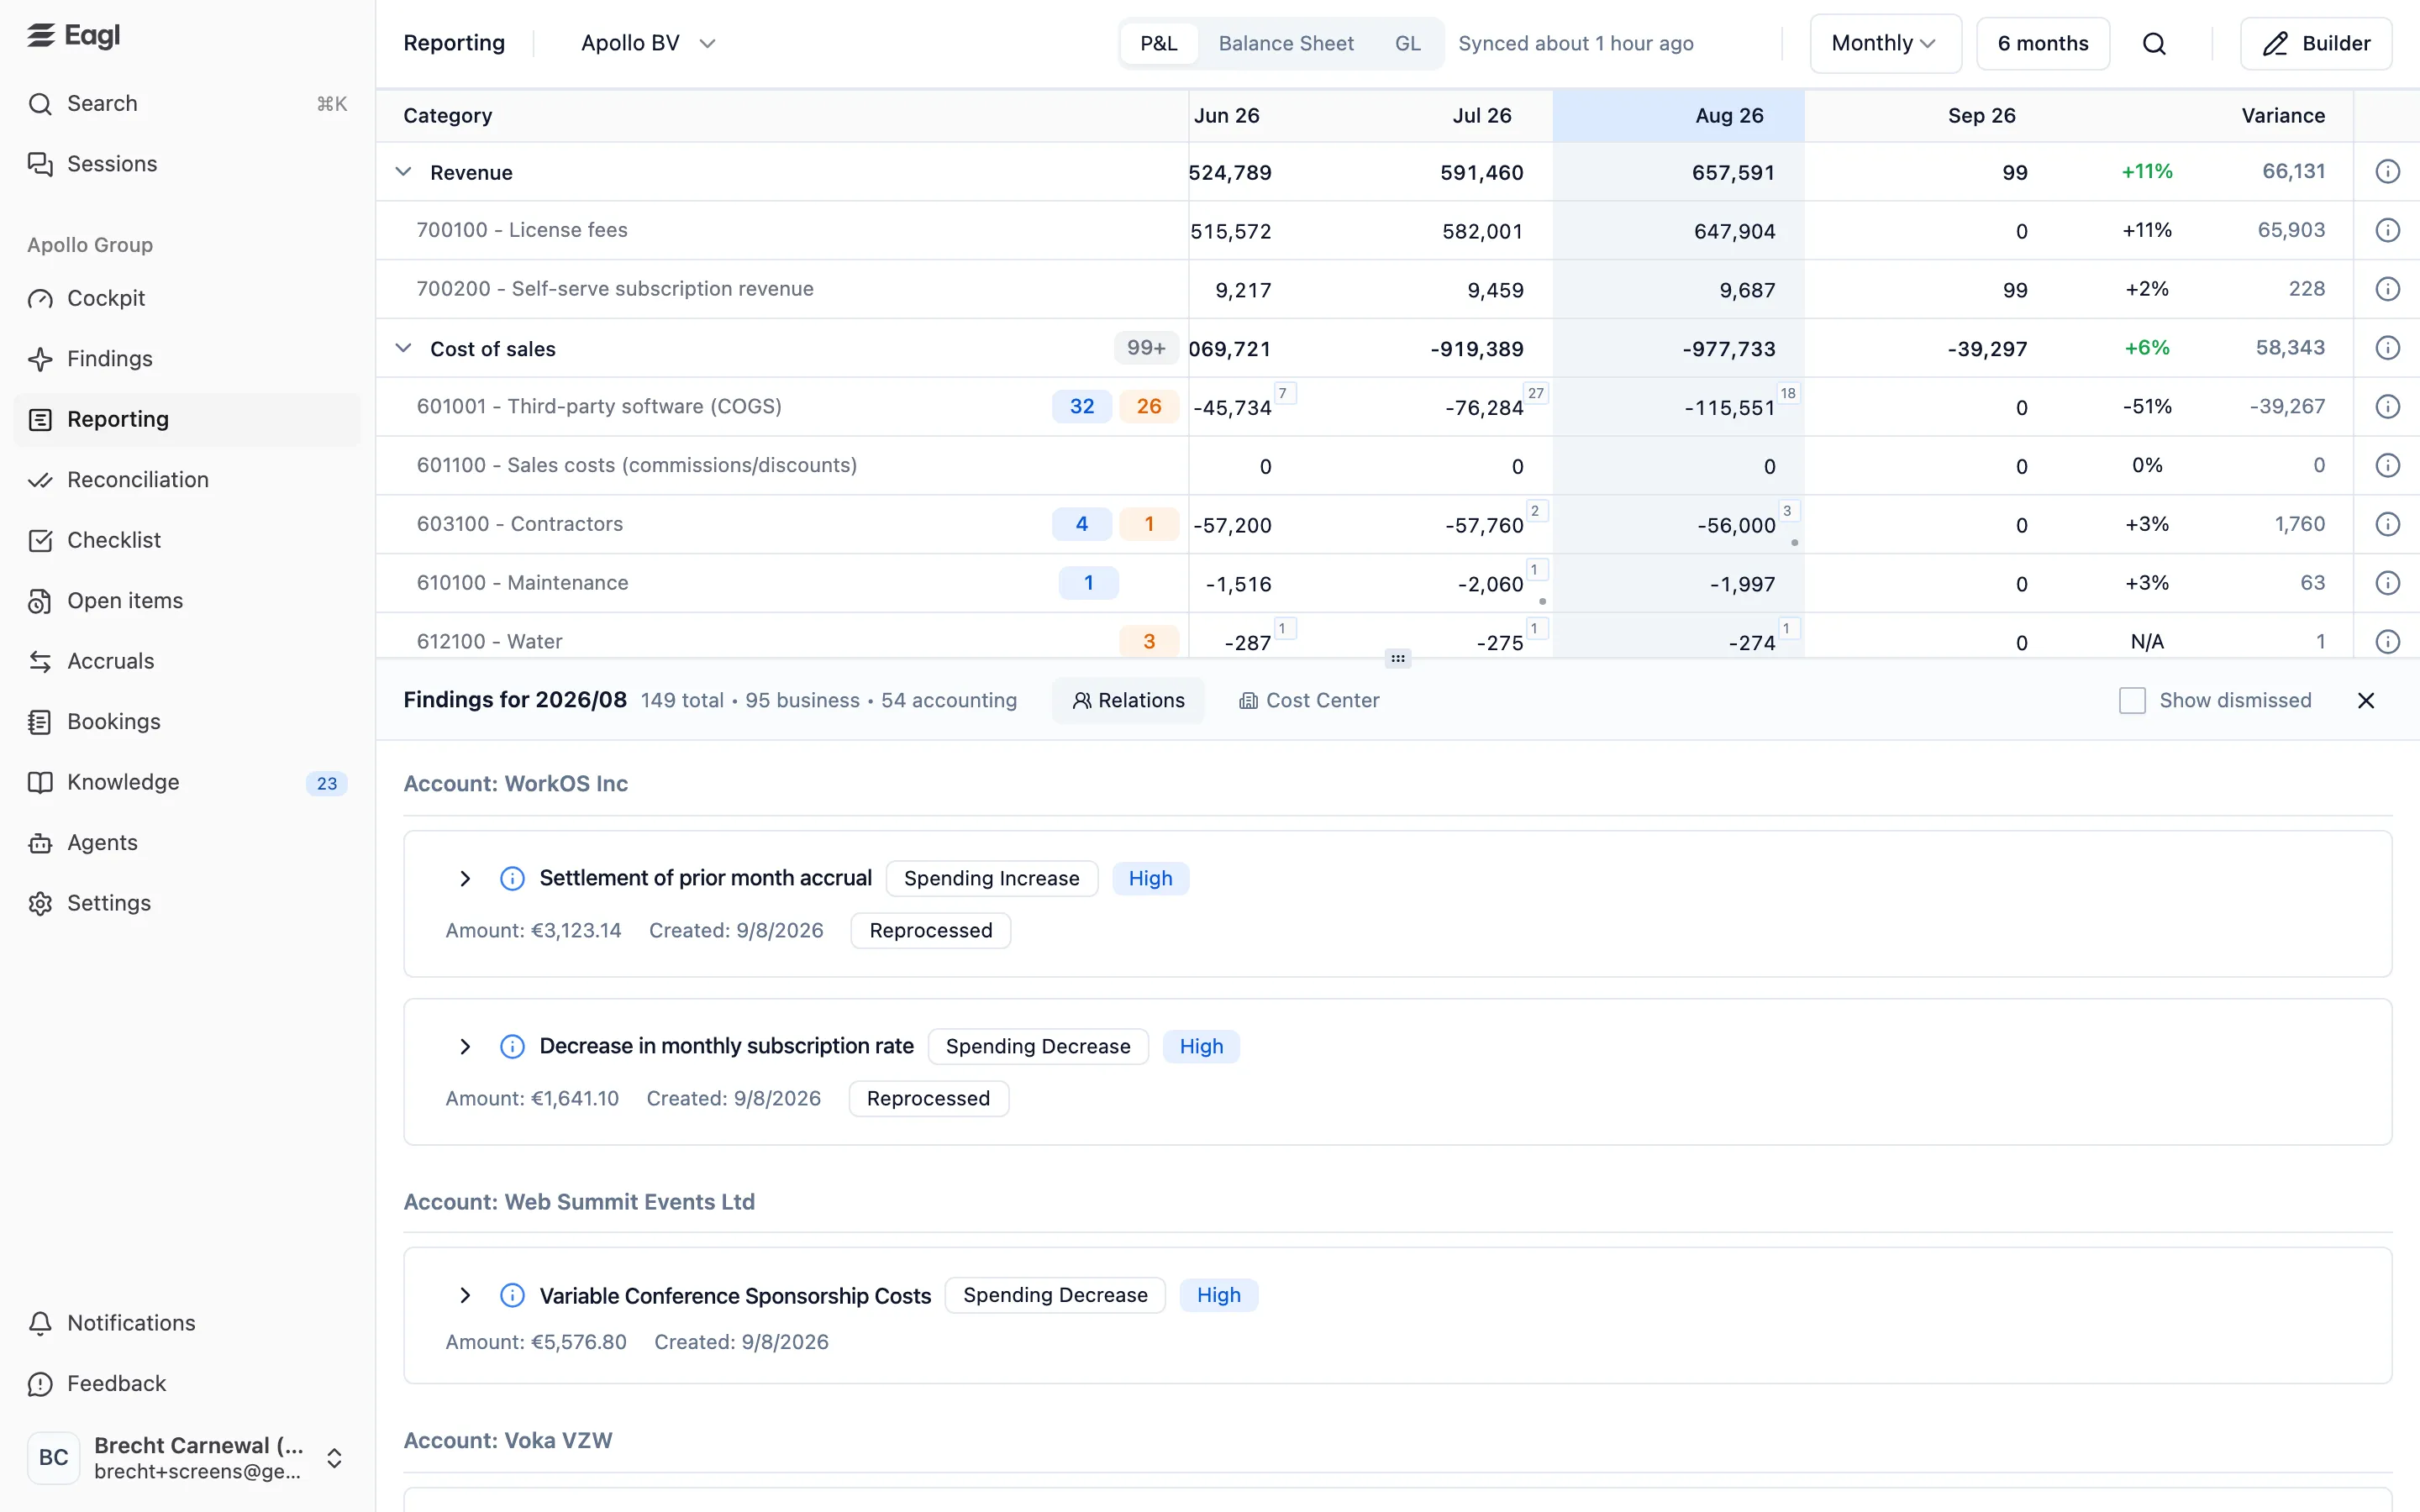
Click a blue, orange, or cell badge, or a column header, to open the Findings panel below the report:
- A blue or orange badge shows that account’s findings for every period on screen.
- A cell badge shows the findings for that account and period only.
- A column header shows every finding for that period.
The panel groups findings by relation or by cost center (switch with the Relations and Cost Center tabs at the top). For an account’s badge, they’re also split by period. Tick Show dismissed to include dismissed findings, and drag the divider to resize the panel. Expand a finding to read its Explanation and the Specific Context, meaning the entries it’s based on.
Business insights are handled right here and in drill-downs rather than on the Findings page. Hover one and click Create task to turn it into a checklist task, or Dismiss it with a reason: No action (correct, but no follow-up needed) or Bad finding (incorrect). Eagl learns from the reason you pick. Once a finding is a task, View task takes you to it. Accounting findings have an Open finding link to the Findings page instead.
Find a GL account
Section titled “Find a GL account”Click the search icon, or press Cmd+F (Ctrl+F on Windows) anywhere on the report. Type a GL code or name:
- Results under On this report take you to the account. Eagl expands its categories and highlights the row.
- Results under Not on this report are GL accounts the structure doesn’t include yet. Selecting one opens the Builder so you can map it.
Notes and AI explanations
Section titled “Notes and AI explanations”Notes keep the story behind a number next to the number.
- Add a note to a cell. Hover an amount, click the pencil, type your note, and click Submit. Cells with a note get a small gray dot in the bottom-right corner. Hover the dot to read the note with its author and date.
- Ask Eagl to explain a movement. Hover an amount and click the sparkle icon (Generate AI note). Eagl looks at the transactions behind the line, relation by relation, and writes a short explanation of what changed compared with the previous month. Once it’s ready, hover the sparkle to read it. If the line had no activity in those months, there’s nothing to explain, and Eagl tells you so.
- See all notes for a line. Click the info icon at the end of a row (View notes). The side panel shows one section per month, newest first, each with the AI Generated Note and your team’s latest note. Click a note to edit it and press Cmd+Enter (Ctrl+Enter) or click away to save. Use the sparkle next to a month to generate or Re-generate its AI note.
Transaction Drill-Down
Section titled “Transaction Drill-Down”Click any GL account’s name or amount in a report to see exactly what makes it up. You also land here from View transactions in a reconciliation account’s panel and from links on findings.
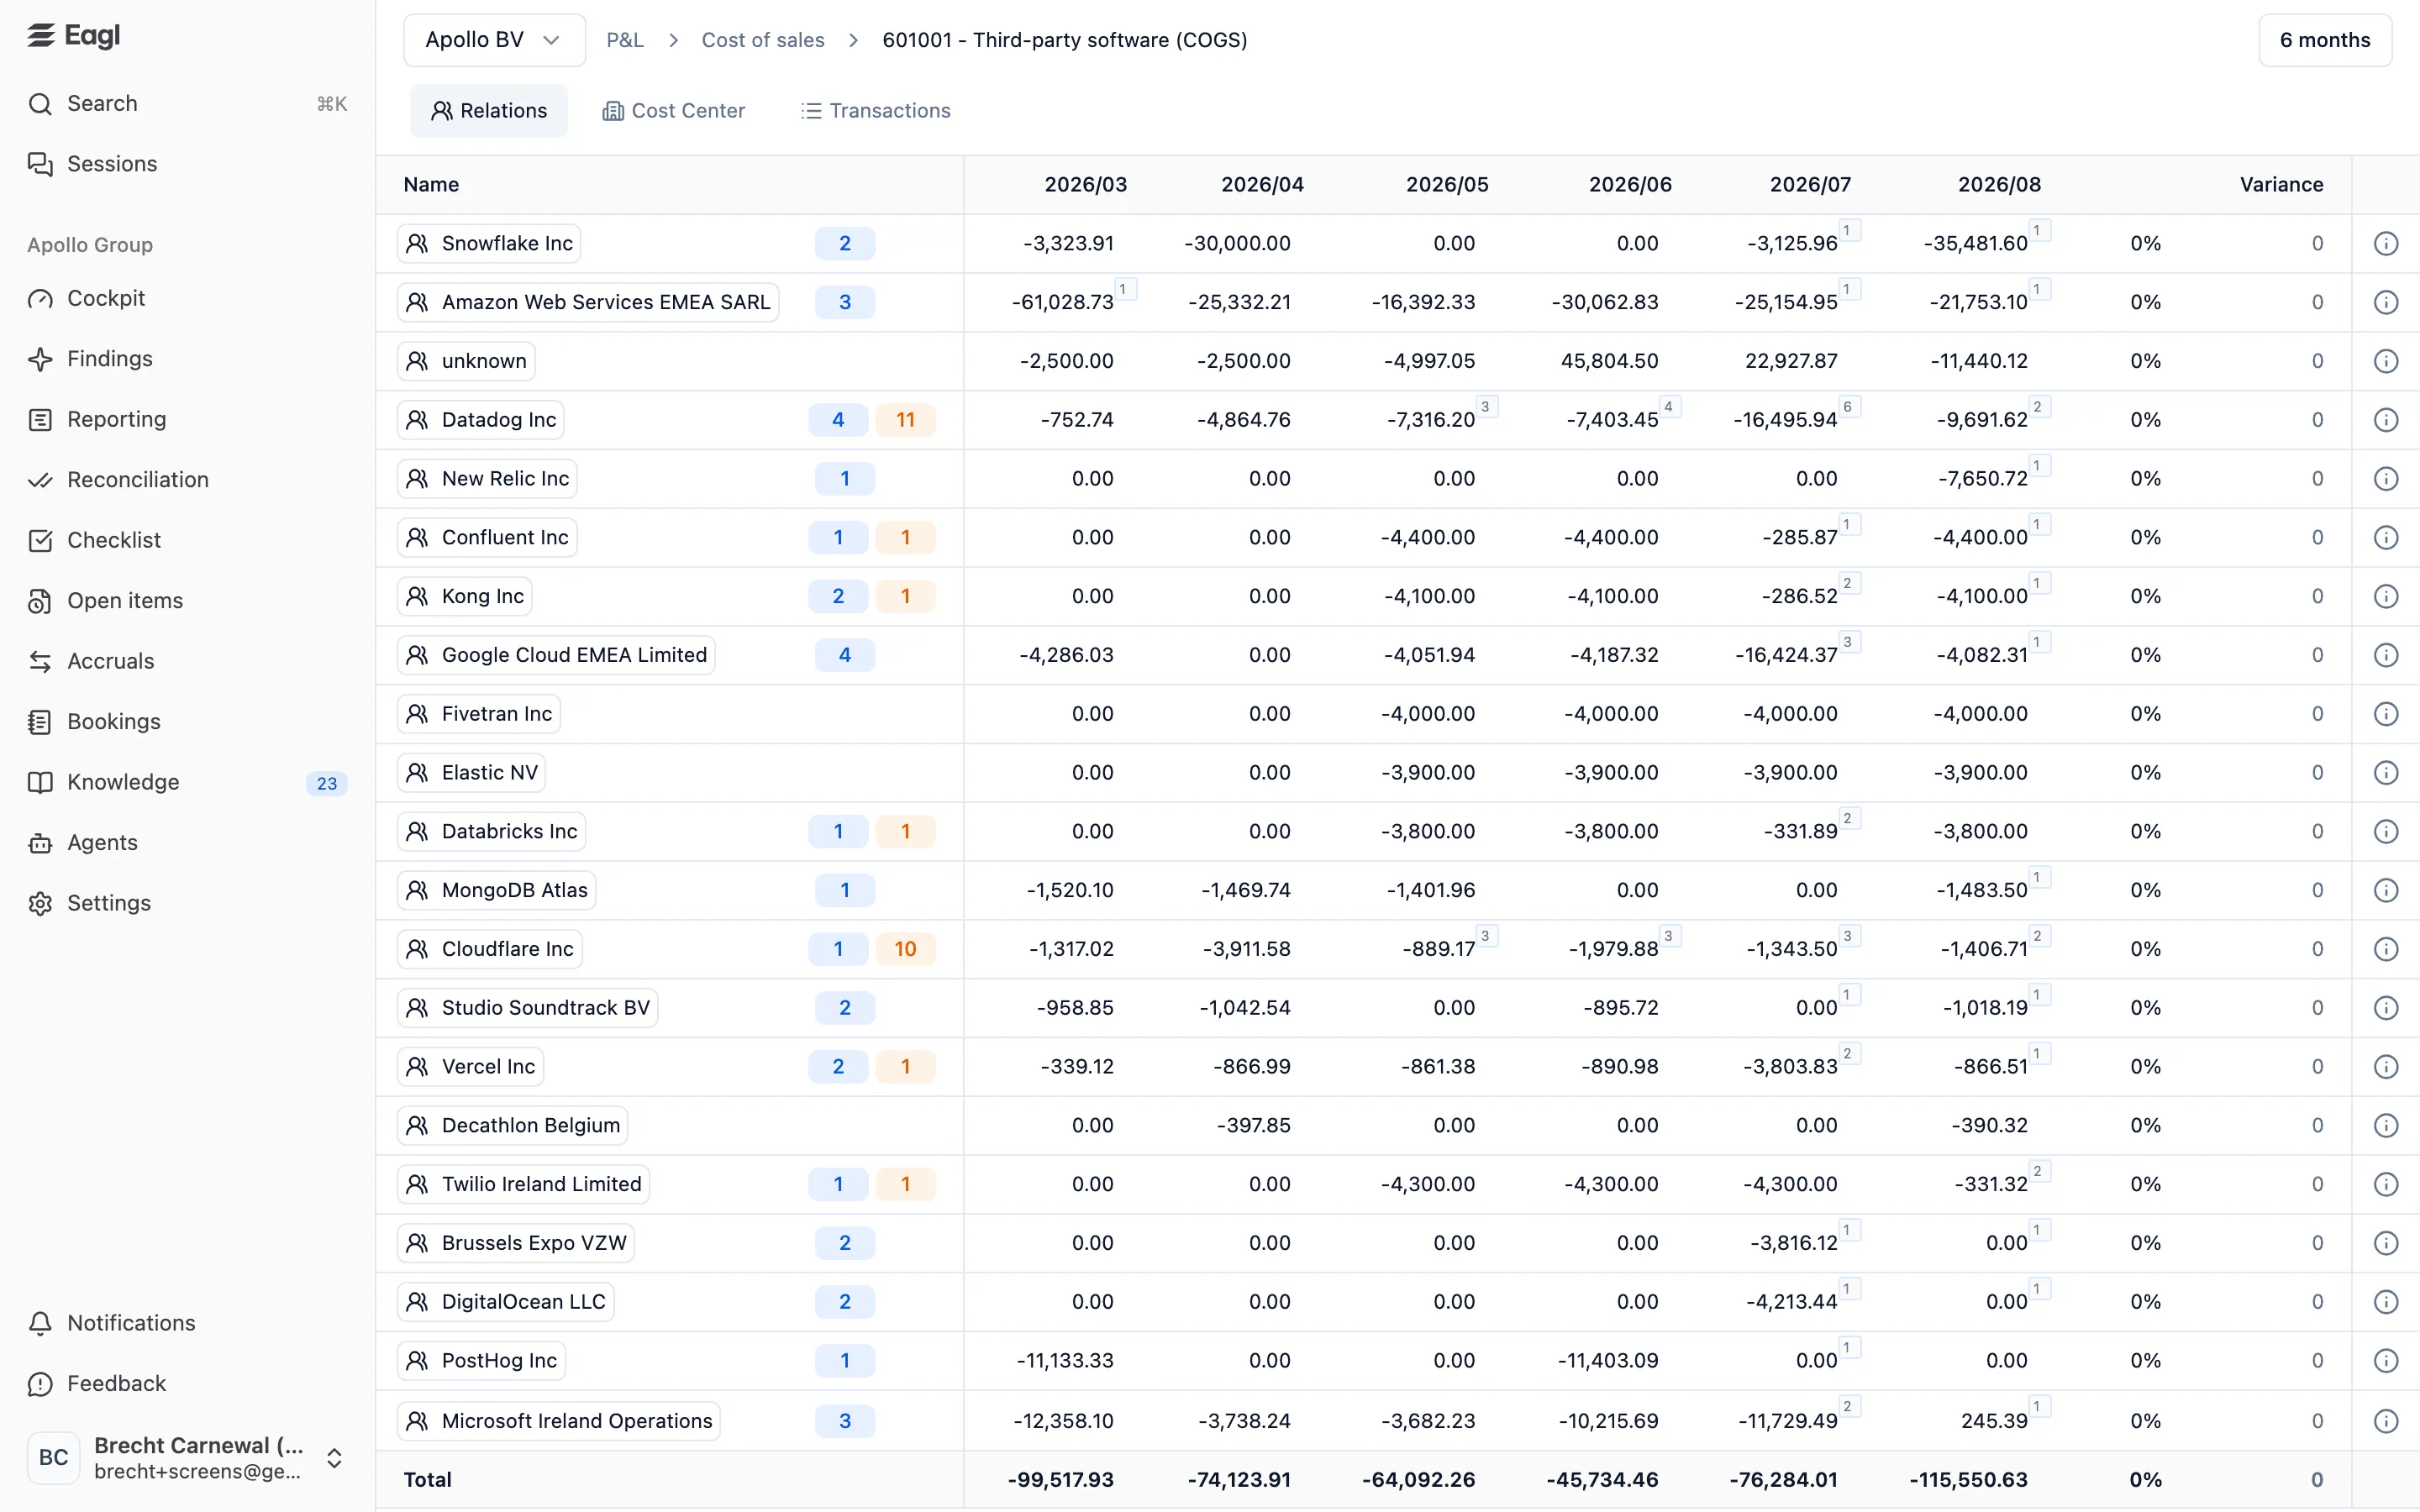
The header shows an entity picker, a breadcrumb back to the report (report, category, account), and a period control. Click the category in the breadcrumb to return to the report with that category open.
Relations, cost centers, and transactions
Section titled “Relations, cost centers, and transactions”| Tab | What it shows |
|---|---|
| Relations | One row per vendor or customer, with monthly amounts, Variance, and a Total row. |
| Cost Center | The same breakdown per cost center. The tab uses your ERP’s name for it, for example Department for NetSuite or Dimension 1 for Business Central. |
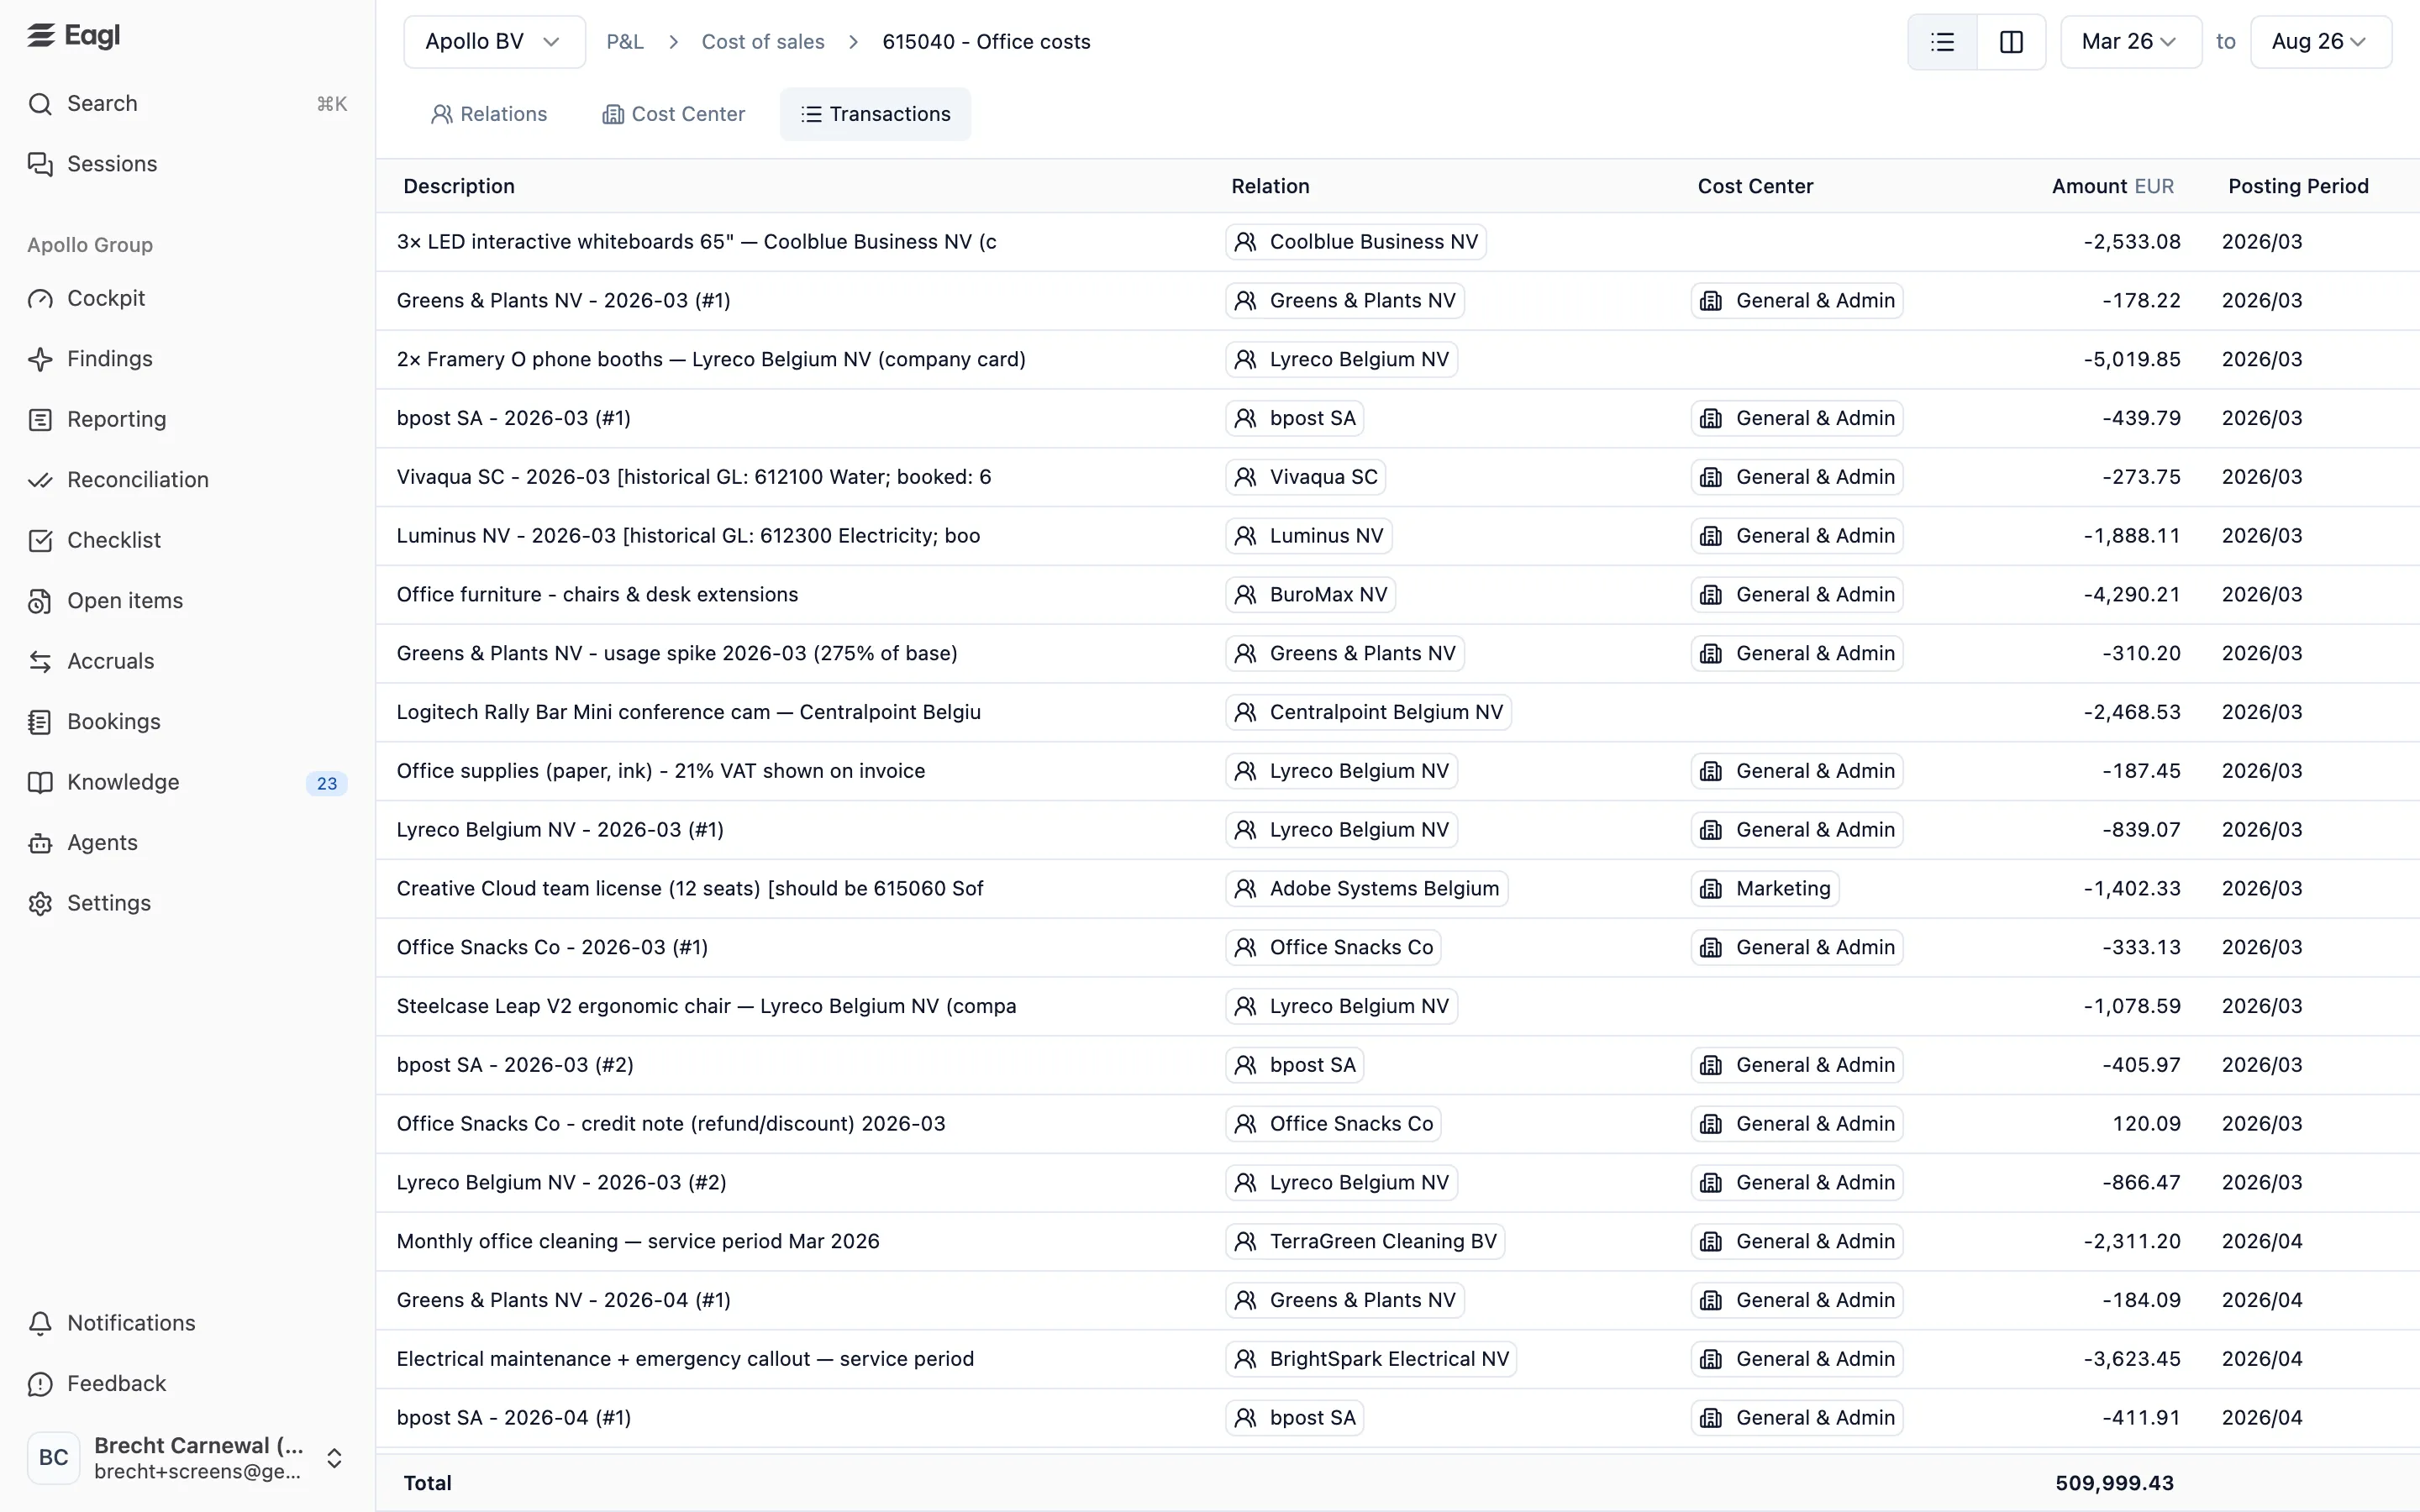
| Transactions | The individual transaction lines: Description, Relation, Cost Center, Amount, and Posting Period, with a total. |
On Relations and Cost Center:
- The months button sets the window: 6, 12, 24, or 36 months. Eagl picks a size that includes the month you came from.
- Click a column header to select that month. The variance then compares it with the month before, and the Findings panel opens for that month.
- Click a relation or cost center name to see just its transactions. A filter chip appears at the top right, and the breadcrumb shows the relation or cost center. Click the × on the chip to clear it.
- Click an amount to see that relation’s transactions for that month.
- Finding badges and the Findings panel work as they do on the report. Hover an amount to add a note to it, and click the info icon at the end of a row to see the notes for that relation or cost center.
On Transactions, choose a period range with the two month pickers. It defaults to the six months up to the selected month, or to the period you clicked in the report. Switch to the side-by-side view (the columns icon) to compare two months’ transactions next to each other. For lines booked in a foreign currency, the original amount and exchange rate show under the amount.
Transaction detail
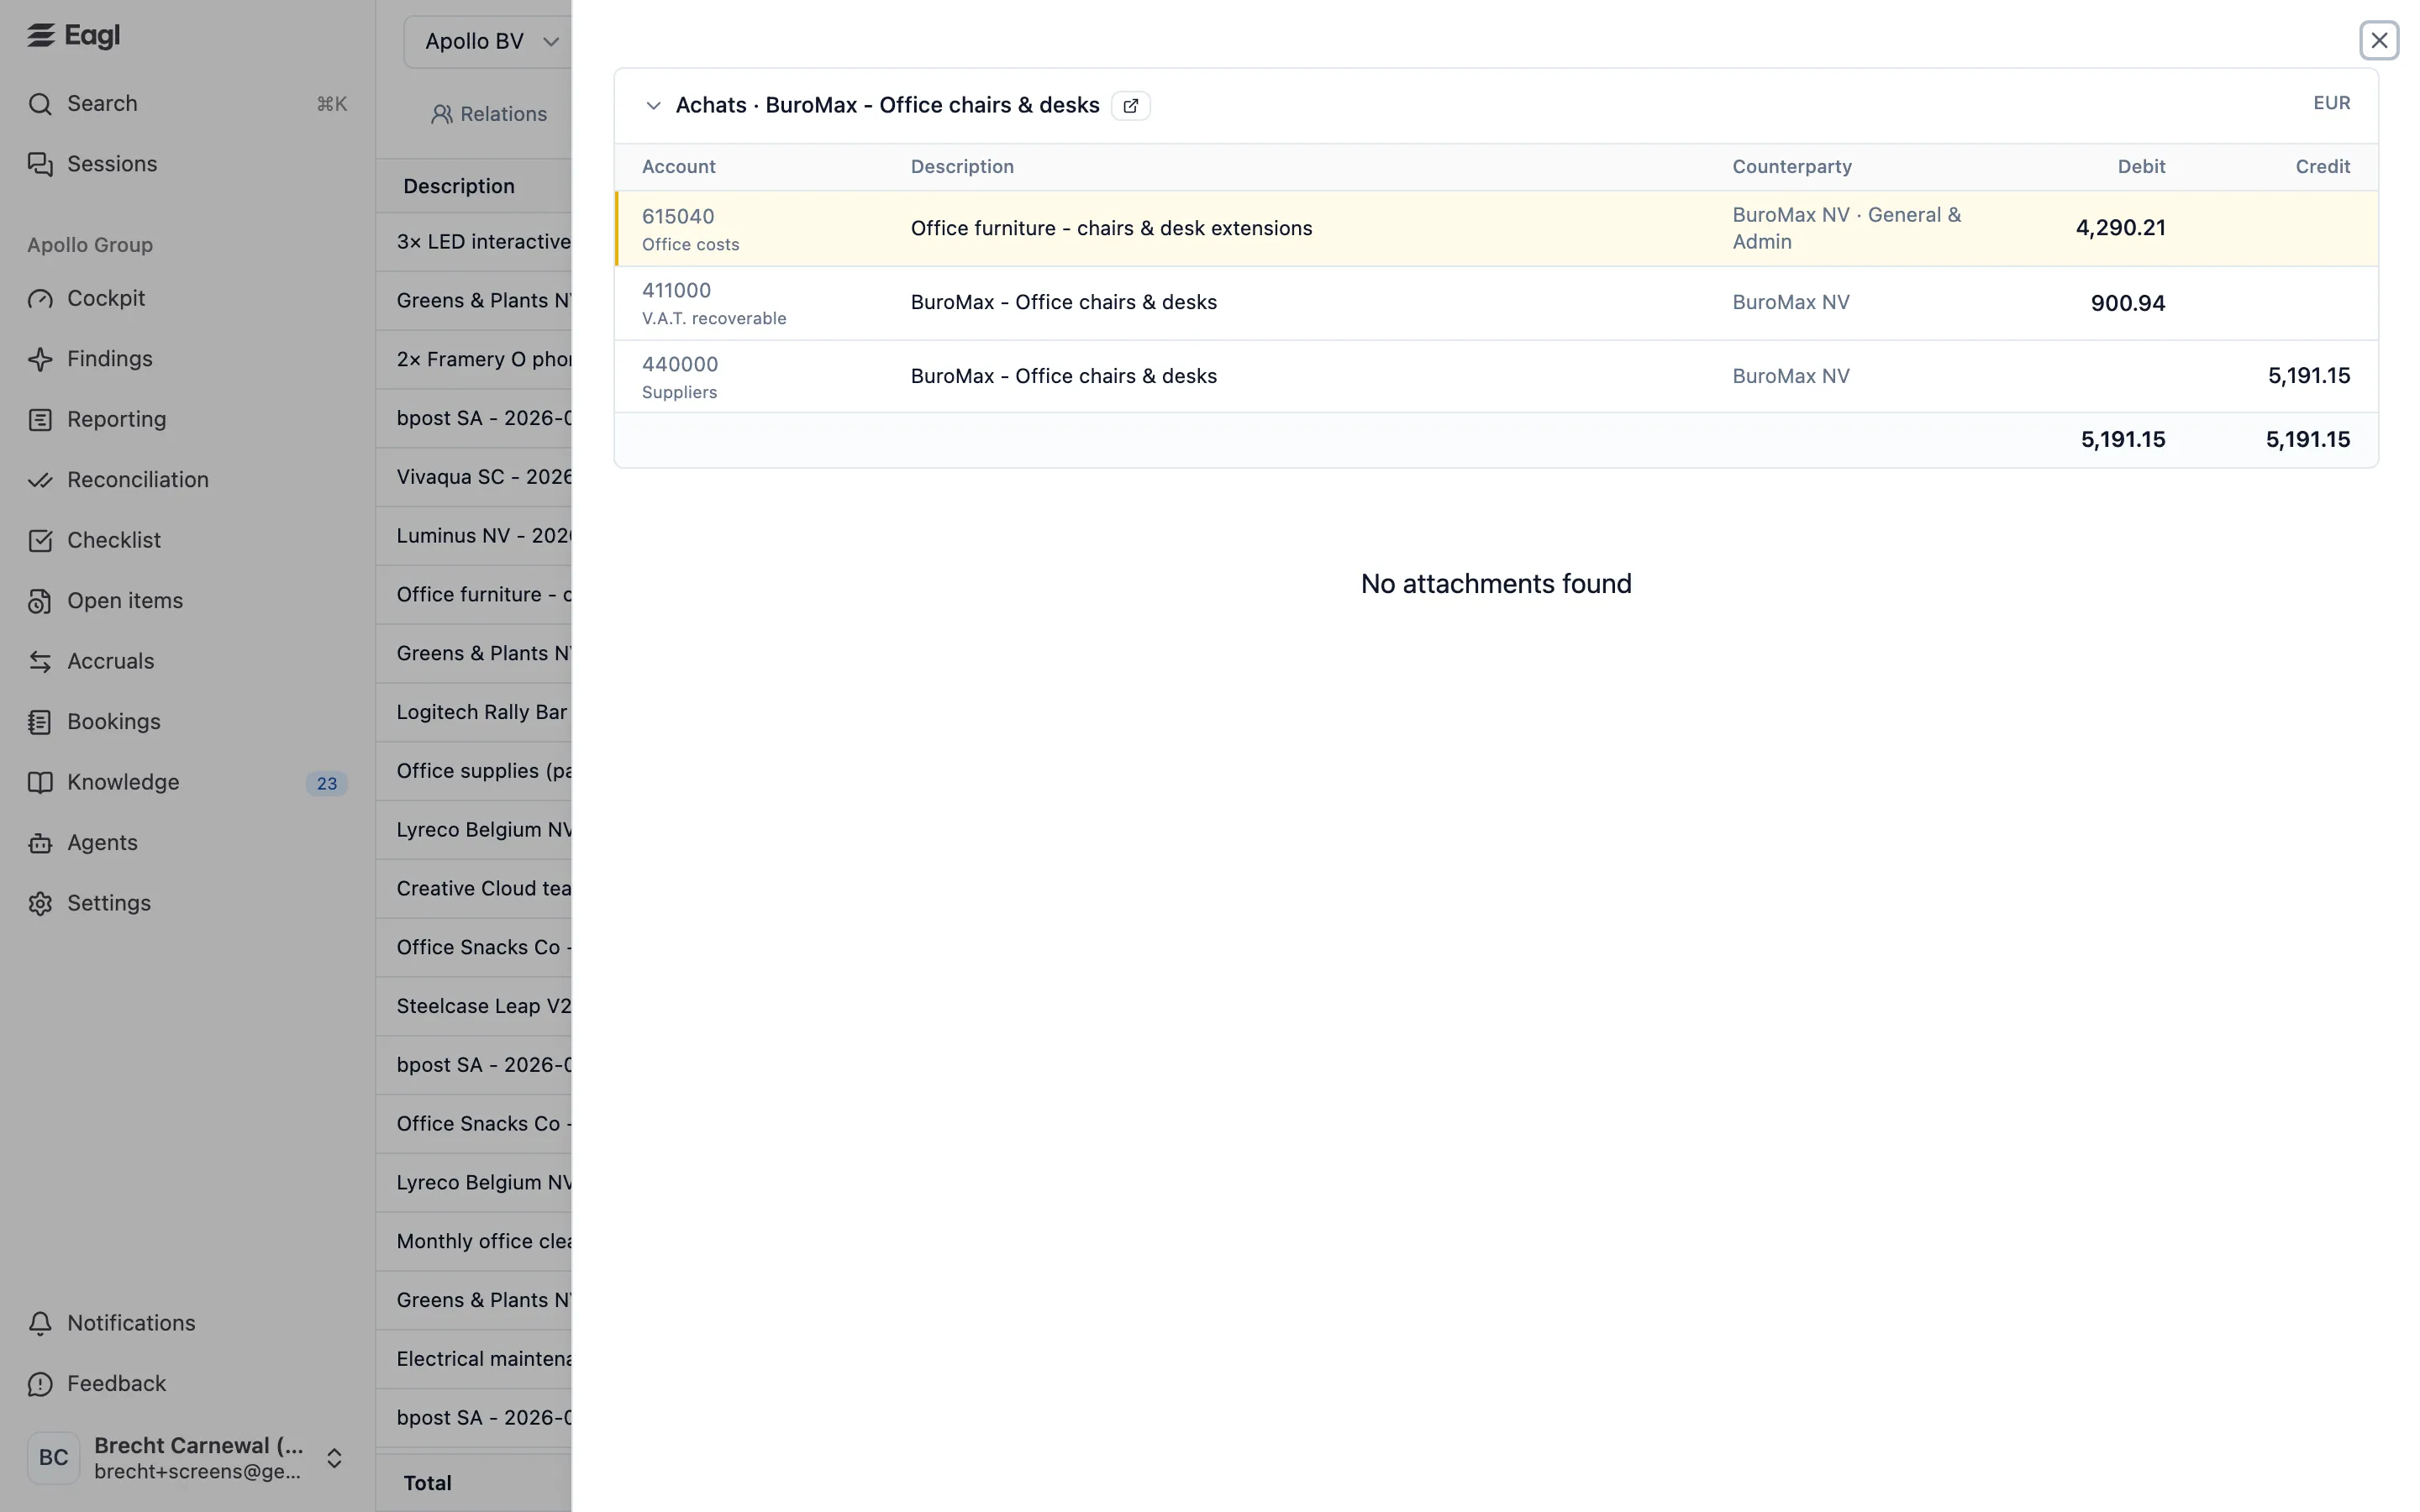
Section titled “Transaction detail”Click a transaction line to open the full journal entry it belongs to:
- Every line of the entry, with Account, Description, Counterparty, Debit, and Credit. The lines on the account you’re drilling into are highlighted.
- A link icon (view in ERP) that opens the entry in your ERP, when available.
- For foreign-currency entries, a toggle to show the amounts as booked.
- Any documents attached to the entry, such as the invoice.
Drill down across entities
Section titled “Drill down across entities”The entity picker on a drill-down lets you pick one entity, several, or All Entities, so you can see an account’s make-up across the group in one view. If the selected entities use different currencies, each line on the Transactions tab shows its own entity’s currency and the total is left blank.
Reporting Builder
Section titled “Reporting Builder”The Reporting Builder is where you review and adjust how GL accounts roll up into the report. Open it with Builder at the top of a report. It edits the report you have open (P&L, Balance Sheet, or GL), and changes apply to every entity.
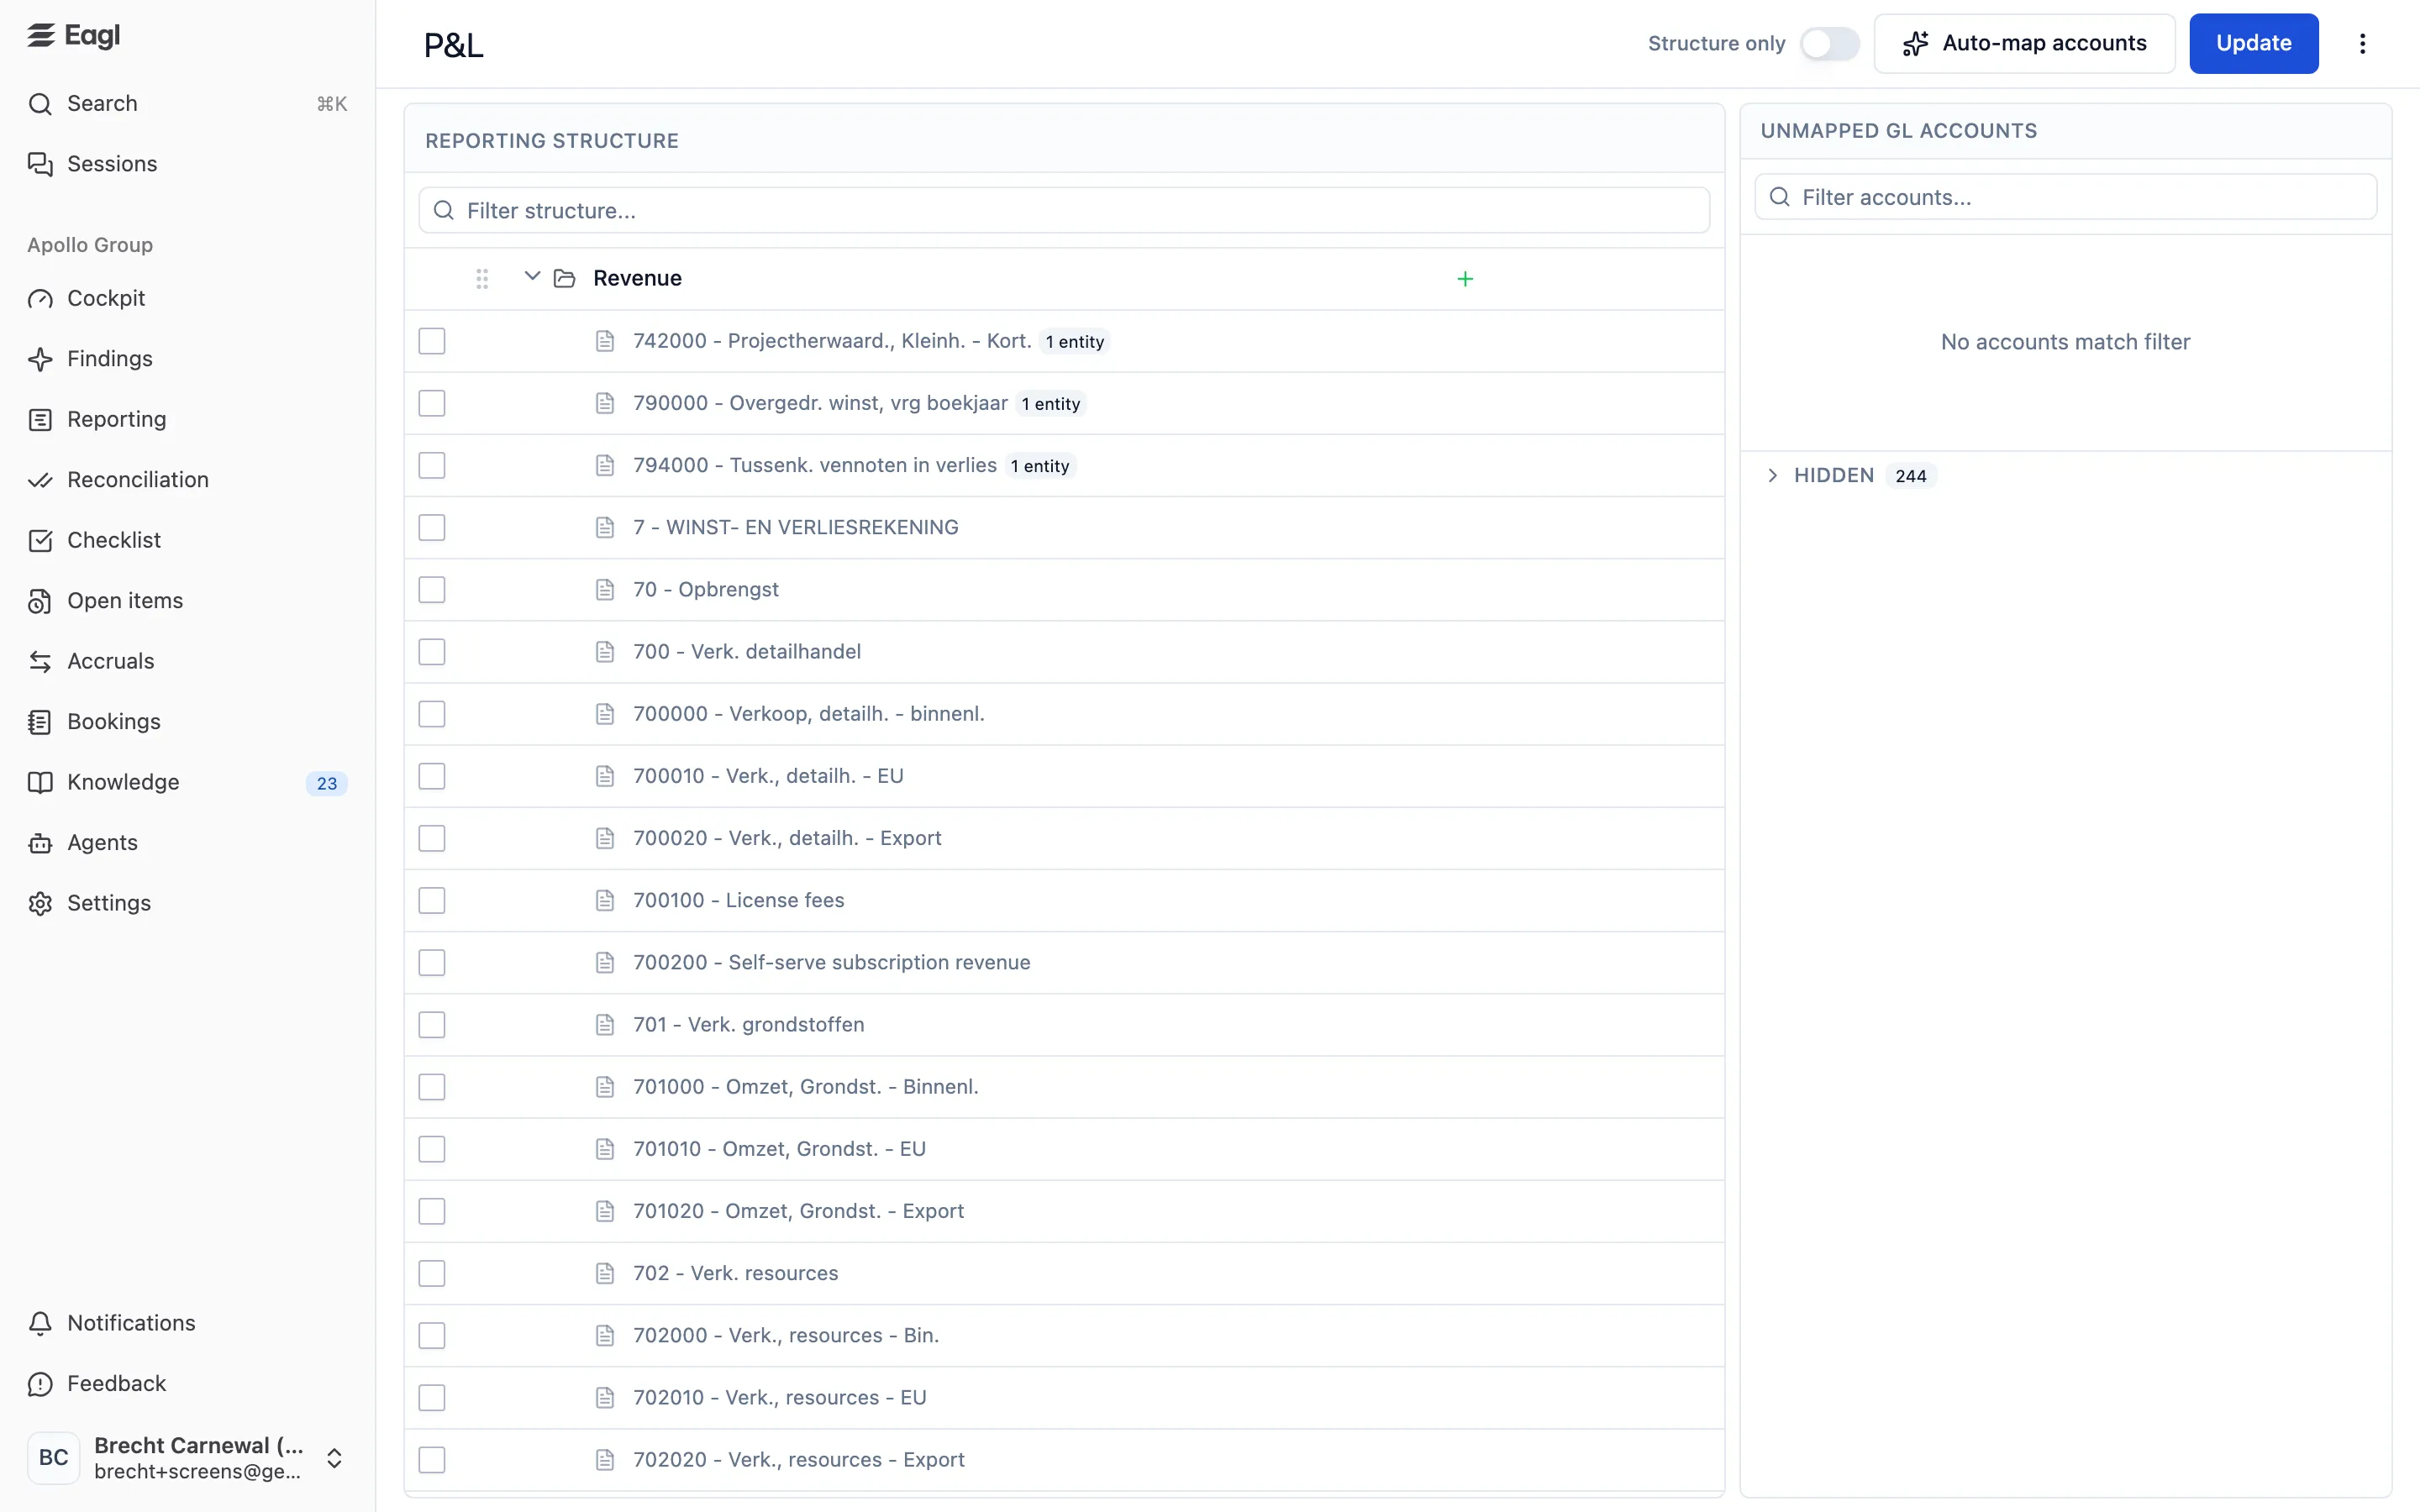
The builder has two panels:
- Reporting Structure (left): the report as a tree of categories, the GL accounts inside them, and calculated lines. Use Filter structure… to find a category or account.
- Unmapped GL Accounts (right): accounts that aren’t on the report yet, each with the last period it was used in (or Never). Accounts you hide are listed under Hidden.
Turn on Structure only to hide the GL accounts and focus on the categories. Two badges can appear on GL accounts in the tree: AI means Eagl placed the account automatically and nobody has saved the structure since, and N entities means the account only applies to some entities.
Map GL accounts
Section titled “Map GL accounts”-
In Unmapped GL Accounts, select one or more accounts. Shift-click selects a range, and Select all selects every account in the list.
-
Click Move to category (M) or press M.
-
Move your pointer over the tree. A dashed Drop … here row previews where the accounts will land: inside a category, or above or below a row. Click to place them. Press Esc or click Cancel to stop.
-
Click Update to save. Eagl takes you back to the report.
To move accounts that are already on the report, select them in the tree and use Move to category (M) the same way. To take an account off the report, click its trash icon (or select several and use the trash icon in the bar at the bottom), and it goes back to the unmapped list.
Hide accounts that don’t belong on this report, such as unused codes. Open an account’s ⋯ menu and choose Hide this account, or select several and click the hide icon. Hidden accounts don’t count as unmapped, and AI mapping skips them. Open Hidden and choose Show this account to bring one back.
Organize categories
Section titled “Organize categories”- Rename: double-click a category or calculated line.
- Reorder: hover a row and use the up and down arrows.
- Move a category: click its grip handle, then click where it should go.
- Add: open a category’s ⋯ menu and choose Add category inside, above, or below, or Add subtotal above or below.
- Remove: click the trash icon. A category must be empty first, and you can’t remove the last one.
- Good or bad when it goes up: on a top-level category, click the + or − indicator to say whether an increase is good or bad for the business. Subcategories inherit it. Eagl uses this when it colors variances.
- Collapsed by default: click a category’s eye icon to have it start collapsed when the report loads.
Balance sheet structures can be at most four levels deep.
Subtotals and formulas
Section titled “Subtotals and formulas”Calculated lines such as Gross margin, EBITDA, and Net result add up other categories and
subtotals. To change one, open its ⋯ menu and choose Edit formula. In the dialog, name the
line, tick the categories or subtotals to include, and set each one to + or −. A preview shows the
result, for example EBITDA = Gross margin + OPEX. Click Save, then Update.
Limit an account to some entities
Section titled “Limit an account to some entities”By default, a GL account maps the same way for every entity. If an account shouldn’t appear on this report for a particular entity, open its ⋯ menu and choose Applies to entities…. The dialog lists each entity with the account’s GL type and whether it’s on the P&L or the balance sheet there. Untick the entities where it shouldn’t appear and click Save. This takes effect right away, without clicking Update. An account can’t be on both the P&L and the balance sheet for the same entity.
Once an account is limited to some entities, the report no longer offers All Entities.
Auto-map with AI
Section titled “Auto-map with AI”Click Auto-map accounts and choose:
- Fill in the rest: AI maps the remaining unmapped accounts into your existing categories and leaves everything you’ve placed alone.
- Start over with AI: clears all mappings, including your manual ones, and lets AI map
everything again. Type
re-mapto confirm. This can’t be undone.
AI only places accounts into your current categories. It never adds, renames, or removes categories.
Save, leave, and review changes
Section titled “Save, leave, and review changes”- Update saves your changes. If you try to leave with unsaved changes, Eagl asks whether to keep editing or discard them.
- ⋮ → Recent activity lists who assigned, moved, removed, or hid which accounts, plus AI mapping runs and balance sheet checks. Changes Eagl made itself are shown as Eagl.
- ⋮ → Export line settings copies the structure to your clipboard as JSON. ⋮ → Import line settings replaces the structure with pasted JSON and saves it right away.
Who can use Reporting
Section titled “Who can use Reporting”Owners, admins, and members can view reports, write notes, generate AI notes, and edit structures in the builder. The Audit role doesn’t have access to Reporting.